
A Practical Report Example: Junior High school level
|
During the early years of junior high school you may be required to write a practical report for an experiment, or an extended experimental investigation (an experiment that takes you a number of days to complete). Here I have provided an example of how a practical report is laid out.
Take note of the language used: 3rd person, past tense, passive voice, and also note that the information written in red are side notes to you, the reader, and are not to be copied into a real practical report. Simon Boman, BSc/ BEd
5 September 2013 |
Bounce efficiency of tennis balls
Aim
What are you trying achieve in this experiment?
To investigate the bounce efficiency of a tennis ball when dropped from various heights.
To investigate the bounce efficiency of a tennis ball when dropped from various heights.
Hypothesis
If _____ then ______ because ______. To see more on this, visit Writing better hypotheses and methods
If the drop height increases, then the resulting bounce height will also increase, because as the drop height increases, so does the gravitational potential energy which can be converted back into kinetic energy on the rebound.
If the drop height increases, then the resulting bounce height will also increase, because as the drop height increases, so does the gravitational potential energy which can be converted back into kinetic energy on the rebound.
Introduction
The experiment will investigate the bounce efficiency of a tennis ball when dropped from different heights.
Explain what is happening in the experiment in relation to relevant theory. In this case, the class was learning about energy transfers, transformations, and types of energy forms. To see more on this, visit Writing better introductions
After it has been dropped, the tennis ball bounces back to a certain extent in relation to its original drop height. At the drop height, the tennis ball has graviational potential energy which is then transformed into kinetic energy as it falls to the ground. Upon impact with the ground this energy is transformed into elastic potential energy when the ball squashes, which is then transformed into kinetic energy again, sending the tennis ball back into the air. These energy transfers and transformations are illustrated in figure 1.

Figure 1: Energy flowchart of a tennis ball (Boman, 2013)
Discussing the variables involved in this experiment.
The variable to be changed in the experiment is the drop height, therefore the drop height will be the independent variable investigated. The effect of changing the drop height will be measured by calculating the bounce efficiency of the tennis ball. This is the dependent variable because it will change in response to the changes made in the bounce height due to the different amounts of gravitational potential energy involved.
A little information on any calculations you will use - particularly if they are uncommon like the one used below.
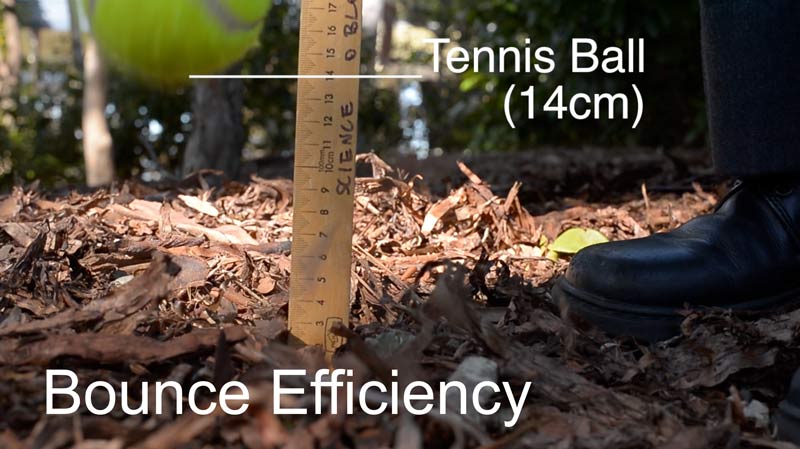
The effect of changing the drop height on the bounce efficiency is found by measuring the resulting bounce height using a meter ruler and sighting the rebound as close to right angles to the ruler as possible to minimise parallax errors. Bounce efficiency is then calculated by the following formula:
Bounce efficiency = bounce height / drop height x 100%
What you expect to happen with your full reasoning - links to theory. This is similar to the 'because' statement in the hypothesis, but it is explained here at length.
It is expected that as the drop height increases, so will the bounce height to a limited extent. It is anticipated that bounce efficiency will remain constant despite being dropped from different heights, this is due to greater gravitational potential energy transforming into greater elastic potential energy in the tennis ball as it hits the ground, which in turn will increase the bounce height accordingly.
Other concepts that are relevant include
The variable to be changed in the experiment is the drop height, therefore the drop height will be the independent variable investigated. The effect of changing the drop height will be measured by calculating the bounce efficiency of the tennis ball. This is the dependent variable because it will change in response to the changes made in the bounce height due to the different amounts of gravitational potential energy involved.
A little information on any calculations you will use - particularly if they are uncommon like the one used below.
The effect of changing the drop height on the bounce efficiency is found by measuring the resulting bounce height using a meter ruler and sighting the rebound as close to right angles to the ruler as possible to minimise parallax errors. Bounce efficiency is then calculated by the following formula:
Bounce efficiency = bounce height / drop height x 100%
What you expect to happen with your full reasoning - links to theory. This is similar to the 'because' statement in the hypothesis, but it is explained here at length.
It is expected that as the drop height increases, so will the bounce height to a limited extent. It is anticipated that bounce efficiency will remain constant despite being dropped from different heights, this is due to greater gravitational potential energy transforming into greater elastic potential energy in the tennis ball as it hits the ground, which in turn will increase the bounce height accordingly.
Other concepts that are relevant include
- Friction & where does it apply in this experiment
- Work (Force applied over a Distance, Work = Force x Distance) & where it applies in this experiment
Risk Assessment
| Equipment | Risks involved | Management |
|---|---|---|
| Tennis Ball | - The ball may hit someone | - Do not throw ball |
| Ruler | - The ruler could poke another student | - Handle with care |
Materials
- 2 x 1 metre rulers
- Tennis balls
- 3 people to: drop, catch and take measurements
- A hard and level surface
Method
| Independent variable | Dependent variable | Controlled Variables |
|---|---|---|
| - Drop height | - Bounce height | - Ball type (tennis ball) |

Figure 2: Diagram of apparatus (Boman, 2013)
|
List as many variables involved as possible in your table above.
|
Or you could write your method like the one below, to see more on this visit how to write better hypotheses and methods
The ruler was placed firmly on the ground at 90° such that it stood as vertically as possible. The tennis ball was then dropped from various heights; 1, 1.5 and 2 meters above a hard surface, using a meter ruler, before it was dropped onto the ground and the resulting bounce height measured. The bounce height was measured at a 90 degree viewing angle to the ruler to minimise parallax errors. The procedure was repeated another 2 times to take the average of the results in a table.
The ruler was placed firmly on the ground at 90° such that it stood as vertically as possible. The tennis ball was then dropped from various heights; 1, 1.5 and 2 meters above a hard surface, using a meter ruler, before it was dropped onto the ground and the resulting bounce height measured. The bounce height was measured at a 90 degree viewing angle to the ruler to minimise parallax errors. The procedure was repeated another 2 times to take the average of the results in a table.
Results
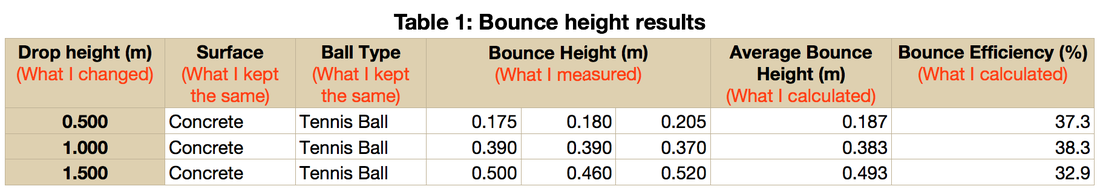
Show your data tables here. To see more about how to make a proper table, visit Skills - Tables and Graphs.
Be sure to insert a graph (see how here), because the eye picks up trends and patterns more easily from a diagram than it does from a table of numbers, plus trend lines can be drawn to extrapolate and interpolate data.
Be sure to insert a graph (see how here), because the eye picks up trends and patterns more easily from a diagram than it does from a table of numbers, plus trend lines can be drawn to extrapolate and interpolate data.
- use graph paper
- put the Independent variable on the x axis and the Dependent Variable on the y axis
- Select an appropriate scale so that the graph covers most of the graph paper
- Hand-draw your graph. Connect the data points that are in succession (i.e., blade numbers 2,3,4 would be connected, but 2, 6 and 12 would not).
|
Sample calculations To show ownership of your results and graphs, it's important to show a sample of the calculations that you have used in your experiment. In this case I have used averages, as well as bounce efficiency calculations. Average = Sum of the trials / number of trials Average bounce height = (0.175m + 0.180m + 0.205m) / 3 = 0.187m Bounce efficiency = Bounce height / drop height x 100% = 0.187m / 0.500m x 100% = 37.3% Note that the table and graphs are labelled (table 1, graph 1) this is important for clarity when you refer to the results found during the discussion section. |
Discussion
State the relationship that you were expecting to find before you performed your experiment. You should be able to find this in your introduction.
It was expected that the bounce height will increase as drop height increases, but will not be quite as high as the original drop height and the resulting bounce efficiency will remain relatively consistent throughout the drop height range. This was because as the ball was dropped from greater heights the gravitational potential energy increased simultaneously, which could then be converted back into kinetic energy as the ball bounced back.
Examine your results. Use them to answer your aim. What do your results show? Which number/length was the best for the STELR model wind turbine? (STELR booklet, Q2, p.52)
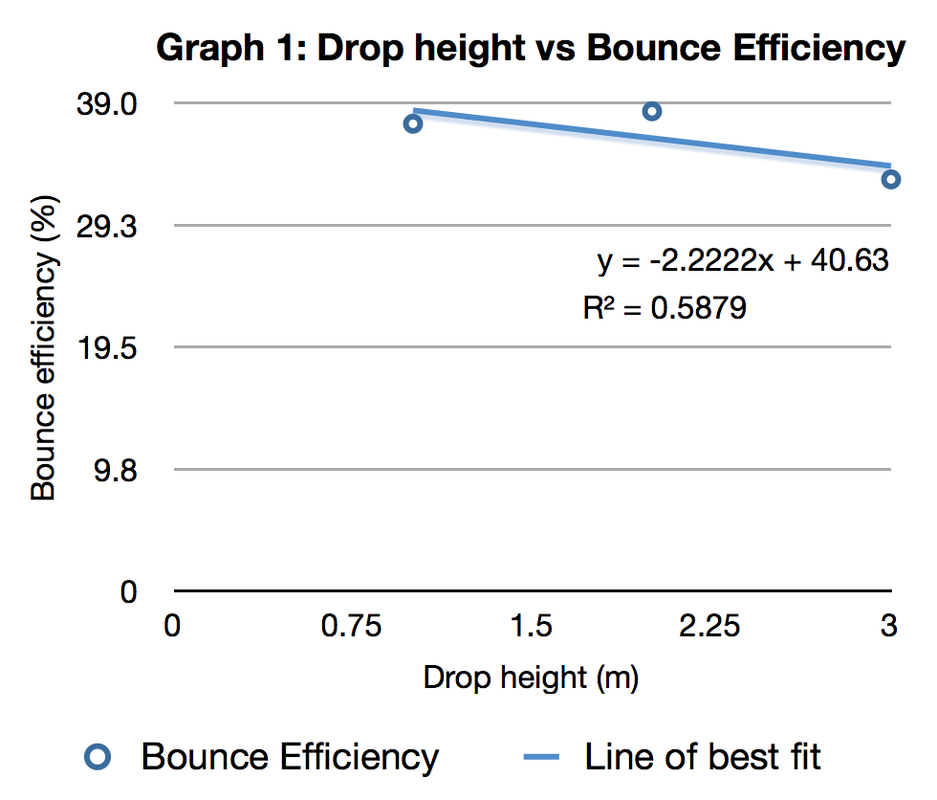
The results from the investigation indicated that the bounce efficiency did not change dramatically as the drop height was increased, however the trend line from graph 1 appears to show a slight decline as the drop height is increased. This trend implies that shorter drop heights are more efficient than larger drop heights. This could be due to the limits of the tennis ball to store kinetic energy as elastic potential energy because it requires increasingly greater amounts of force is to continue to squash the ball by the same amount when it lands. For example, it is easier to squash the ball a little, than it is to squash the ball to half its original height, due to an increase in air pressure inside the ball when squashed.
How reliable do you think your results were? Discuss. How could you modify your procedure to make your results more reliable? (STELR, box 6 & 7, p.54)
The reliability of the experiment was limited to the method which the bounce height was measured. Since the tennis ball reached its apex height on the rebound at a high speed, it was difficult to measure with adequate precision with sight alone. Parallax errors were difficult to avoid as the bounce height was slightly different for each trial. To improve the reliability of the results for this experiment, one could use high speed video captures which could be slowed down to measure accurately against the ruler in the background. The original drop height also varied to a degree due to the nature of releasing the tennis ball by hand. This drop height could be standardised by using a mechanical mechanism in which to drop the ball at consistent heights, such as rolling the ball down an elevated ramp onto the floor.
What is one modification you would make to how you conducted the experiment, in light of your experience? (STELR booklet, Q3, p.52)
In light of the recent experience gained through this experiment, it is apparent that three data points are not sufficient to draw a conclusive trend line, as it is difficult to currently tell whether the trend is linear (straight) or perhaps curved. Future experiments should investigate the bounce efficiency over a greater number of drop heights to provide more data points to map out the trend.
What are the implications of your findings for commercial wind mills? (STELR booklet, Q4, p.52)
There are limited applications of these findings to commercial purposes, unless one would need to estimate the height at which an object would bounce from vast drop heights. This could be done by calculating the bounce efficiency of the object at smaller heights, and extrapolated using the efficiency to find the estimated bounce height. This could apply to space rover landings that use airbags to reduce impact upon planetary surfaces, where bounce height could affect the final landing location.
It was expected that the bounce height will increase as drop height increases, but will not be quite as high as the original drop height and the resulting bounce efficiency will remain relatively consistent throughout the drop height range. This was because as the ball was dropped from greater heights the gravitational potential energy increased simultaneously, which could then be converted back into kinetic energy as the ball bounced back.
Examine your results. Use them to answer your aim. What do your results show? Which number/length was the best for the STELR model wind turbine? (STELR booklet, Q2, p.52)
The results from the investigation indicated that the bounce efficiency did not change dramatically as the drop height was increased, however the trend line from graph 1 appears to show a slight decline as the drop height is increased. This trend implies that shorter drop heights are more efficient than larger drop heights. This could be due to the limits of the tennis ball to store kinetic energy as elastic potential energy because it requires increasingly greater amounts of force is to continue to squash the ball by the same amount when it lands. For example, it is easier to squash the ball a little, than it is to squash the ball to half its original height, due to an increase in air pressure inside the ball when squashed.
How reliable do you think your results were? Discuss. How could you modify your procedure to make your results more reliable? (STELR, box 6 & 7, p.54)
The reliability of the experiment was limited to the method which the bounce height was measured. Since the tennis ball reached its apex height on the rebound at a high speed, it was difficult to measure with adequate precision with sight alone. Parallax errors were difficult to avoid as the bounce height was slightly different for each trial. To improve the reliability of the results for this experiment, one could use high speed video captures which could be slowed down to measure accurately against the ruler in the background. The original drop height also varied to a degree due to the nature of releasing the tennis ball by hand. This drop height could be standardised by using a mechanical mechanism in which to drop the ball at consistent heights, such as rolling the ball down an elevated ramp onto the floor.
What is one modification you would make to how you conducted the experiment, in light of your experience? (STELR booklet, Q3, p.52)
In light of the recent experience gained through this experiment, it is apparent that three data points are not sufficient to draw a conclusive trend line, as it is difficult to currently tell whether the trend is linear (straight) or perhaps curved. Future experiments should investigate the bounce efficiency over a greater number of drop heights to provide more data points to map out the trend.
What are the implications of your findings for commercial wind mills? (STELR booklet, Q4, p.52)
There are limited applications of these findings to commercial purposes, unless one would need to estimate the height at which an object would bounce from vast drop heights. This could be done by calculating the bounce efficiency of the object at smaller heights, and extrapolated using the efficiency to find the estimated bounce height. This could apply to space rover landings that use airbags to reduce impact upon planetary surfaces, where bounce height could affect the final landing location.
Conclusion
The conclusion very briefly summarises the findings of the experiment and relates these back to the Hypothesis. "The results of the experiment support/do not support the hypothesis that as ..."
The aim of the investigation was to determine the bounce efficiency of a tennis ball at varying heights and it was hypothesised that as the drop height was increased, so too will the bounce height due to the extra gravitational potential energy being added with an increase of drop height. The findings indicated subtle changes occur in the bounce efficiency of the tennis ball ranging from 37.3% to 32.9%, but with an overall decline in the chosen linear trend line. The results of the experiment support the hypothesis that as drop height increases, so too will the bounce height due to an increase in gravitational potential energy, however the bounce efficiency remained relatively consistent.
The aim of the investigation was to determine the bounce efficiency of a tennis ball at varying heights and it was hypothesised that as the drop height was increased, so too will the bounce height due to the extra gravitational potential energy being added with an increase of drop height. The findings indicated subtle changes occur in the bounce efficiency of the tennis ball ranging from 37.3% to 32.9%, but with an overall decline in the chosen linear trend line. The results of the experiment support the hypothesis that as drop height increases, so too will the bounce height due to an increase in gravitational potential energy, however the bounce efficiency remained relatively consistent.